require(pacman)
p_load(tidytuesdayR, tidyverse, trashpanda, magick)Coastal Ocean Temperatures
ocean
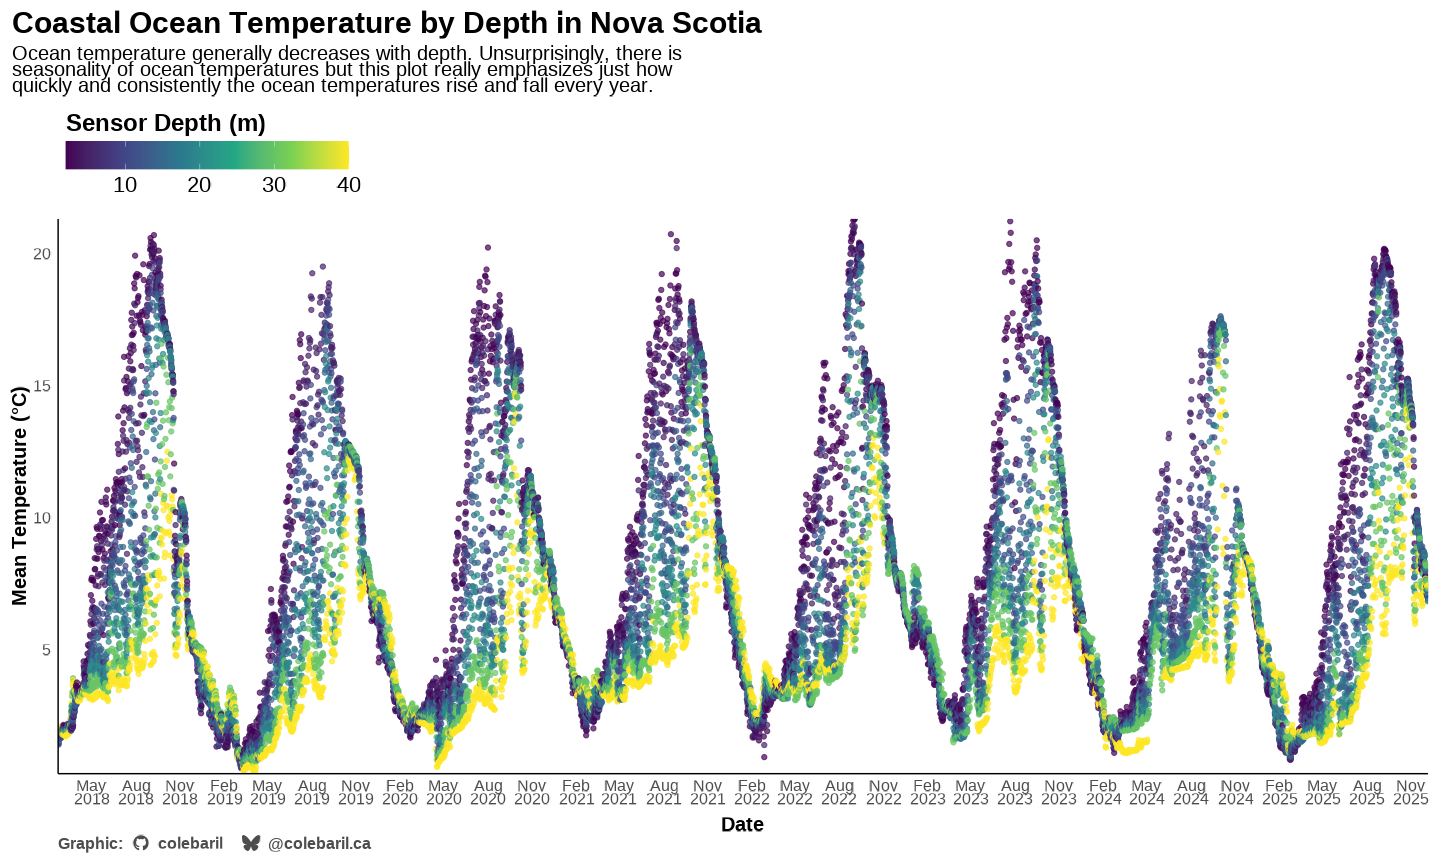
Coastal ocean temperatures from Nova Scotia.
Load Packages
Load Data
tuesdata <- tidytuesdayR::tt_load('2026-03-31')
ocean_temperature <- tuesdata$ocean_temperature
ocean_temperature_deployments <- tuesdata$ocean_temperature_deployments
Plot
plot <- ocean_temperature |>
  ggplot() +
  geom_point(aes(x = date, y = mean_temperature_degree_c, colour = sensor_depth_at_low_tide_m),
             alpha = 0.7) +
  scale_colour_viridis_c("Sensor Depth (m)") +
  scale_x_date(date_breaks = "3 months", date_labels = "%b\n%Y",
               expand = c(0, 0)) +
  scale_y_continuous(expand = c(0, 0)) +
  theme_cole(remove_grid = TRUE, base_size = 15) +
  theme(axis.line = element_line(),
        axis.title.x = element_text(margin = margin(t = 10)),
        plot.title = element_text(hjust = 0),
        plot.subtitle = element_text(hjust = 0),
        legend.position = "top",
        legend.key.size = unit(1, "cm"),
        legend.key.width = unit(2, "cm"),
        legend.title.position = "top",
        legend.justification = "left") +
  add_caption_cwb() +
  labs(x = "Date", y = "Mean Temperature (°C)",
       title = "Coastal Ocean Temperature by Depth in Nova Scotia",
       subtitle = str_wrap("Ocean temperature generally decreases with depth. Unsurprisingly, there is seasonality of ocean temperatures but this plot really emphasizes just how quickly and consistently the ocean temperatures rise and fall every year."))

# Save and display images
current_dir <- dirname(knitr::current_input())
plot_name <- "ocean_temp.png"

ggsave(plot = plot,
       dpi = "screen",
       width = 20,
       height = 12,
       device = ragg::agg_png,
       filename = file.path(current_dir, plot_name))


# Read the big plot
img <- image_read(file.path(current_dir, plot_name))

# Force 16:9 aspect ratio with minimal padding
# Target size: 1200x675 px (16:9)
img_card <- image_scale(img, "1200x675")           # scale to fit inside 16:9
img_card <- image_extent(
  img_card,
  geometry = "1200x675",
  gravity = "center"
)

# Save as card preview
image_write(img_card, path = file.path(current_dir, "preview.png"))

knitr::include_graphics(
  file.path(current_dir, plot_name)
)
References
cite_packages(format = "rmd")Ooms J (2025). magick: Advanced Graphics and Image-Processing in R. doi:10.32614/CRAN.package.magick https://doi.org/10.32614/CRAN.package.magick, R package version 2.9.0, https://CRAN.R-project.org/package=magick.
Baril C (2026). trashpanda: Cole’s Personal Collection of R Functions, Themes, and Palettes. R package version 0.0.1, commit d16de29303b66b1398238885a35c8a8b1aaf077f, https://github.com/colebaril/trashpanda.
Grolemund G, Wickham H (2011). “Dates and Times Made Easy with lubridate.” Journal of Statistical Software, 40(3), 1-25. https://www.jstatsoft.org/v40/i03/.
Wickham H (2025). forcats: Tools for Working with Categorical Variables (Factors). doi:10.32614/CRAN.package.forcats https://doi.org/10.32614/CRAN.package.forcats, R package version 1.0.1, https://CRAN.R-project.org/package=forcats.
Wickham H (2025). stringr: Simple, Consistent Wrappers for Common String Operations. doi:10.32614/CRAN.package.stringr https://doi.org/10.32614/CRAN.package.stringr, R package version 1.6.0, https://CRAN.R-project.org/package=stringr.
Wickham H, François R, Henry L, Müller K, Vaughan D (2023). dplyr: A Grammar of Data Manipulation. doi:10.32614/CRAN.package.dplyr https://doi.org/10.32614/CRAN.package.dplyr, R package version 1.1.4, https://CRAN.R-project.org/package=dplyr.
Wickham H, Henry L (2026). purrr: Functional Programming Tools. doi:10.32614/CRAN.package.purrr https://doi.org/10.32614/CRAN.package.purrr, R package version 1.2.1, https://CRAN.R-project.org/package=purrr.
Wickham H, Hester J, Bryan J (2025). readr: Read Rectangular Text Data. doi:10.32614/CRAN.package.readr https://doi.org/10.32614/CRAN.package.readr, R package version 2.1.6, https://CRAN.R-project.org/package=readr.
Wickham H, Vaughan D, Girlich M (2025). tidyr: Tidy Messy Data. doi:10.32614/CRAN.package.tidyr https://doi.org/10.32614/CRAN.package.tidyr, R package version 1.3.2, https://CRAN.R-project.org/package=tidyr.
Müller K, Wickham H (2026). tibble: Simple Data Frames. doi:10.32614/CRAN.package.tibble https://doi.org/10.32614/CRAN.package.tibble, R package version 3.3.1, https://CRAN.R-project.org/package=tibble.
Wickham H (2016). ggplot2: Elegant Graphics for Data Analysis. Springer-Verlag New York. ISBN 978-3-319-24277-4, https://ggplot2.tidyverse.org.
Wickham H, Averick M, Bryan J, Chang W, McGowan LD, François R, Grolemund G, Hayes A, Henry L, Hester J, Kuhn M, Pedersen TL, Miller E, Bache SM, Müller K, Ooms J, Robinson D, Seidel DP, Spinu V, Takahashi K, Vaughan D, Wilke C, Woo K, Yutani H (2019). “Welcome to the tidyverse.” Journal of Open Source Software, 4(43), 1686. doi:10.21105/joss.01686 https://doi.org/10.21105/joss.01686.
Harmon J, Hughes E (2025). tidytuesdayR: Access the Weekly ‘TidyTuesday’ Project Dataset. doi:10.32614/CRAN.package.tidytuesdayR https://doi.org/10.32614/CRAN.package.tidytuesdayR, R package version 1.2.1, https://CRAN.R-project.org/package=tidytuesdayR.
Rinker TW, Kurkiewicz D (2018). pacman: Package Management for R. version 0.5.0, http://github.com/trinker/pacman.